— Real-time data provides insights into competitive position, market trends, and risk mitigation strategies during uncertain times —

The transition from 2019 into 2020 proved to be more difficult for mortgage lenders than in past years. In the switch of a year and the blink of an eye, the world changed dramatically.

The first quarter of 2020 ushered in a sea of change, including a worldwide pandemic, national and state stay-at-home orders, significant economic challenges, business shutdowns, record unemployment, and more.

Yet, despite it all and fueled by a lengthy period of historically low rates, today’s lenders generated a record number of mortgage rate locks in the first quarter — production levels rarely experienced in our industry.

As the federal government continued to provide stimulus and assistance to consumers, businesses and the economy as a whole, the challenging market volatility experienced in Q1 of 2020 did not subside in the second quarter. Nor did the heavy mortgage volumes.

Mortgage investors and servicers changed pricing, product eligibility requirements and underwriting standards at a record clip, further multiplying the complexities facing mortgage lenders. Now, as many states begin to open back up and start their economic engines, opportunities and challenges are once again shifting.

No matter what comes next, successful mortgage lenders have learned that maximum market transparency is the key to anticipating and understanding rapidly changing conditions.

Real-time data and comprehensive analytics are at the heart of market transparency, providing highly sought-after insights into competitive position, market trends and risk mitigation strategies amid these uncertain times.

Although Optimal Blue did not initially develop its actionable data and analytics products with a global pandemic in mind, they serve as a perfect fit for what lenders need in this volatile and dynamic environment.

The largest single source of rate lock data, Optimal Blue provides the mortgage industry with information on pricing and key transaction variables 60 to 90 days before closing data is available.

Updated daily, Optimal Blue’s rate lock data is deep and comprehensive, including a robust set of transactional data elements such as loan product, property type, LTV, FICO, geographical location, borrower demographics and more.

Representing over one-third of all mortgage loans completed within the industry every year, Optimal Blue’s platform locks more than $1 trillion of mortgage loans annually.

Optimal Blue’s actionable data and analytics products provide clients and partners with highly granular, early insights across the entire mortgage market. Delivered in raw data form and through a visually compelling analytics tool, Optimal Blue has drawn particularly strong interest from a diverse array of companies, including mortgage lenders, mortgage investors, investment firms and industry regulators.

In addition, attention has grown across public policy think tanks that study the mortgage industry, such as the American Enterprise Institute (AEI), as well as risk analytics and consulting firms for residential loans and MBS, and mortgage insurance providers like Genworth. Optimal Blue’s data and analytics enable users within those companies to:

1. Benchmark against the competition.

In today’s highly competitive industry, lenders need to not only understand their position relative to their competition but also have access to the tools that provide visibility into those specifics. Optimal Blue’s data and analytics products provide that sought-after transparency.

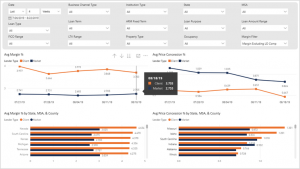
Lenders that use Optimal Blue’s Product & Pricing Solution can leverage Optimal Blue’s Competitive Analytics to more effectively analyze the competition, understand overall market composition, create competitive comparisons in real time and effectively evaluate how their margins measure up — both as a whole and at the more detailed, MSA level. This can help inform smarter lending strategies and decisions moving forward.

“Lenders that utilize Competitive Analytics are far better equipped to make agile decisions and take appropriate action, particularly in times of market uncertainty and fluctuation,” said Rick Allen, vice president of Business Transformation at Optimal Blue. “Their ability to remain nimble is in large part due to their use of a real-time, transactional data set as opposed to surveyed or aged data.”

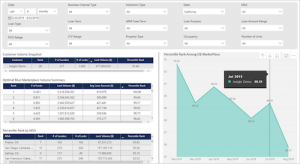
For lenders that are not using Optimal Blue’s Product & Pricing Solution, Optimal Blue’s Market Analytics product enables any lender to benchmark their production against the broader market in a variety of different ways, including loan types, rate and price, FICO, LTV and more.

2. Focus marketing efforts.

When analytics are broken down at the geographical level, lenders gain visibility into new opportunities, have the power to better refine their outreach efforts and make more effective use of marketing dollars.

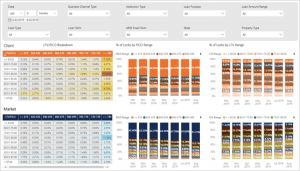
Optimal Blue’s Competitive Analytics product analyzes transactional mortgage data on over 350 MSAs across the country, offering visibility into local loan volume, pricing and other trends. Each granular filter enables the lender to hone into specific loan programs and assess trends across various timeframes, and due to the diversity and extensive reach of Optimal Blue’s network, data is available on a wide range of scenarios.

Lenders can then leverage this data to identify high-potential markets and better allocate financial and human resources. It can also cut down on wasted ad spend.

3. Understand borrower segments.

Borrowers can vary widely from one market to the next, in profile and in behavior. Actionable analytics can help lenders better grasp these market-level nuances, offering insights into borrower credit scores, LTV, DTI, loan amounts, property types and more. Further, they can even spot trends related to loan use which can inform better investment, hedging and resource allocation decisions.

AEI Housing Center produces a weekly research product focused specifically on the mortgage industry, called the “AEI Housing Market Nowcast” (formerly the Flash HMI Report). Released every Monday, the Housing Market Nowcast provides much-needed and timely insights on the single-family residential housing market convulsing from the effects of the Coronavirus Disease 2019 (COVID-19) pandemic.

“Using newly acquired data from Optimal Blue, the AEI Housing Center is now able to provide near-real-time market indicators on purchase loan rate lock volume, home price, credit, and cash out refinance trends,” said Ed Pinto, resident fellow and director of the AEI Housing Center.

“After extensive historical analysis of Optimal Blue data going back seven years, we have concluded that this rate lock data tracks closely with that which is reported in our National Mortgage Risk Index (NMRI), covering 99% of the agency market. As a result, today’s Housing Market Nowcast will provide an advanced look at tomorrow’s housing market as today’s rate locks will become next month’s home purchases and mortgages.”

4. Predict and leverage industry-wide trends.

Optimal Blue’s Market Analytics product enables users to better understand ongoing market tendencies, including trends in refinancing, specific loan products, home price trends and mortgage volume as a whole.

Because of its frequency, depth and overall position in the mortgage process, Market Analytics users gain an early indication of closing volume months before it occurs. Confidently understanding the mix of business that the industry will close in future months can be an immense benefit to lenders and other firms, such as mortgage insurance companies, that provide valuable services to the mortgage industry.

“In order to remain a committed, long-term provider of relevant products and services to the mortgage industry, it is imperative that Genworth closely monitors the trends, hotspots, and overall mix of business within industry,” said Kevin McMahon, senior vice president of Customer Solutions at Genworth. “Because Optimal Blue’s data and analytics products leverage actual mortgage rate lock data, our company has early and very detailed insight into industry closing activity, months before it occurs.”

5. Fine-tune MBS and MSR analytics to effectively mitigate risk.

With access to loan-level pricing, rate and loan data that covers over one-third of the market, lenders can improve predictive modeling efforts and reduce risk. Various studies using Optimal Blue’s Mortgage Market Indices (“OBMMI”) or custom indices derived from Optimal Blue’s Market Analytics product have shown the increased precision of using a more granular and accurate primary rate input, which can significantly improve prepayment modeling and estimates of refinance propensity.

The depth and granularity of Optimal Blue’s data may also help lenders and risk analytics and consulting firms for residential loans and MBS, like Andrew Davidson & Co., Inc. (AD&Co.), produce more vigorous prepayment forecasts in the future. Because the data is based on actual rates locked by consumers and fully reflects all risk-based pricing adjustments, it is proven to be more precise than the static risk-based spreads that many firms use for MBS and MSR analytics. A more accurate primary rate input results in a better prepayment prediction, which helps drive improved buy/sell and pricing decisions.

“Accurate and timely market data should be a part of every modeler’s toolkit,” explained Sanj Chatterjee, director of Modeling for Andrew Davidson & Co. “Optimal Blue’s rate lock data helps us monitor the evolution of rates on a continuous basis, especially for FHA, VA and jumbo prime loans.”

Making the case for data & analytics

Data and analytics that enable participants to benchmark against the competition and understand the impact of trends as early as possible are status quo in most every industry. While this level of granular business intelligence has always been important, conditions are now changing at such a pace that it would be incredibly difficult for any lender to keep up without it.

Being able to make informed decisions amid rapidly changing conditions, and doing so in near real time, leads to more effective and more profitable results — making actionable data and analytics a critical ingredient of success over the long haul.

“Operating in today’s volatile mortgage market without the right data is like taking a road trip without your GPS,” Allen concluded. “You might find your way with a lot of trial and error, but it won’t be the best or most economical path forward by any means.”

This piece was originally featured on HousingWire.com.

###

PRESS CONTACT FOR OPTIMAL BLUE
Robert J. Brandt
Vice President, Marketing & Strategic Alliances
(469) 609-5585
bbrandt@optimalblue.com

— Competitive Analytics provides sophisticated industry benchmarking capabilities —

Optimal Blue’s position as the largest provider of secondary marketing automation gives it unique visibility into $750 billion of loan transactions across its Mortgage Marketplace Platform.

The company is using that data to create business intelligence solutions that provide benchmarking at an unprecedented scale.

Optimal Blue started with Enterprise Analytics, released two years ago to shed light on lenders’ margins and profitability through dynamic visualizations of their internal locks and change requests.

This summer, the company launched another powerful BI tool: Competitive Analytics.

This game-changing innovation enables Optimal Blue clients to gauge performance through granular illustrations of their market position, compare margins and profitability and assess the effectiveness of current pricing strategies.

Competitive Analytics provides three types of sophisticated industry benchmarking capabilities, including:

Volume benchmarking: Allows the user to compare their loan production to the overall market and chart volume trends across specific time periods – by week, month, or year. In addition, volume benchmarking provides a trended production percentile market rank by business channel, institution type, state, MSA, loan type and other parameters, as well as the ability to compare the percentage of their locks that observed change requests or lock extensions to the overall market.

Lending profile benchmarking: Enables clients to compare characteristics of their loan production by charting loan level parameters such as FICO, LTV, loan amount, property type, occupancy, loan type and loan purpose against the overall market.

Pricing strategies benchmarking: Provides a market comparison for a variety of secondary marketing metrics that impact profitability. Clients can compare margins, concessions, price and note rate to the market, and filter by business channel, institution type, state, MSA and more.

Future offerings will measure market share by origination volume, providing unrivaled transparency into the mortgage market through widgets available to lenders and other interested parties, like MI companies or investors, through a subscription.

Competitive Analytics is updated with new transactional data daily, which is a sharp contrast to historical HMDA data or survey data that lenders had to depend on in the past.

“Lenders are hungry for this kind of information because it puts the power in their hands,” said Scott Happ, CEO of Optimal Blue. “Our clients are really delighted with their sudden ability to have full visibility into what’s happening elsewhere in the market and with their peers.”

This piece was originally featured on HousingWire.com.

###

PRESS CONTACT FOR OPTIMAL BLUE
Robert J. Brandt
Vice President, Marketing & Strategic Alliances
(469) 609-5585
bbrandt@optimalblue.com

— With Optimal Blue’s Competitive Analytics, lenders get anonymized transactional data that’s updated daily —

In any industry, it’s hard to win if you don’t know what your competition is doing. Traditionally, lenders have relied upon just a few very limited options to do so, such as often flawed survey data based on a very small market sampling, latent servicing data illustrating what business looked like six or more months ago, or an annual HMDA ranking. Suffice to say, none of these resources enabled them to effectively compare the current state of their business to those they compete with.

Optimal Blue has upended those concerns with a powerful new business intelligence offering called Competitive Analytics. This solution touts daily updates of comprehensive transactional data and features insightful visualizations that can be configured through a variety of highly granular filters.

Competitive Analytics is powered by data from actual mortgage transactions across the country and is updated every night, providing the most accurate, granular, and timely view of mortgage transactions available in the industry.

Further, the solution enables lenders to benchmark their results against the overall market in the areas that matter most, resulting in far more informed corporate decision-making and highly targeted lending strategies.

“Competitive Analytics is the only product available to lenders that provides such an extraordinary level of market transparency and sophisticated business intelligence,” said Optimal Blue CEO, Scott Happ. “Our clients are incredibly excited about their ability to benchmark against peers, as well as with the wealth of innovative new tools to create, adapt, and confirm winning business strategies.”

Optimal Blue’s market share is what makes this competitive analysis possible. As the largest provider of secondary marketing automation to the mortgage industry, Optimal Blue floats on a sea of operational and transactional data. One of every three mortgage loans completed nationwide every year are priced and locked through the Optimal Blue platform, uniquely positioning the company to provide meaningful and unrivaled benchmarks.

Competitive Analytics uses fully anonymized transactional data, a game-changer for Optimal Blue clients concerned about compliance and privacy. The company laid the foundation for its suite of business intelligence solutions by investing heavily in data infrastructure, building its data warehouse from the ground up and partnering with Microsoft to house and analyze Optimal Blue data in Microsoft’s Azure Data Lake.

How competitive are my lending strategies?

One of the many hallmarks of the Competitive Analytics solution lies in the advanced filtering capabilities, which were built and designed with extensive client feedback.

With Competitive Analytics, lenders can easily determine whether their market share is growing or declining and how it’s evolving over any configurable range of time. Lenders can choose to filter by loan type, loan purpose, and loan amount. They can also drill down by state, MSA level, or a user-defined market area to gauge their performance as it relates to FICO range, LTV, property type, occupancy, and more.

“Competitive Analytics enables insightful decisions that ignite action by intelligently grouping large chunks of data for comparison, and then providing lenders the tools to slice that data however they want,” explained Erin Wester, senior product manager.

The data that populates Competitive Analytics is interactive and interrelated, allowing lenders to observe trends across a diverse set of product and borrower profiles at the same time.

For example, a lender can see that they are closely aligned with the market in northwest Texas on conforming loans with credit scores over 680 and loan-to-value ratios above 80%, while also confirming an opportunity for growth in an entirely new market, like California, where they have been considering an FHA, non-conforming, or non-qualifying mortgage (Non-QM) product offering aimed at specific borrower profiles.

How does my profitability stack-up?

While Competitive Analytics does a masterful job at providing visibility into market share, its value continues through unique insights into lender profitability.

Users can compare rate and price to determine where they are operating at a higher or lower margin than others – with or without the impact of loan officer compensation. Then, directly next to those visualizations, Optimal Blue clients can also see what portion of their margins are being eroded by concessions and how concessions offered compare to the overall marketplace.

“It’s easy to overwhelm people with data. We wanted to provide out-of-the box capabilities to dig deep on front-of-mind questions, like whether their price is competitive and how their margins or concessions compare to other lenders in their producing markets,” Wester said.

“This really gets into profitability, not only providing lenders with the tools to highlight where they are most competitive, but – more importantly – illustrating where they can adjust resources and strategies to be even more competitive and profitable.”

Where do I rank in my current (or future) markets?

Another unique feature of Competitive Analytics is the analysis into the efficiency of a lender’s lock desk. A comprehensive volume snapshot lets lenders view their rank based on their number of locks and lock volume, as well as post-lock changes.

The unique and well-known lock desk management functionality of Optimal Blue’s PPE powers the data collection of how many change requests a lender receives and how long it takes to process those changes.

By leveraging that data, Competitive Analytics empowers lenders with deep visibility into their operations and unique comparisons to the overall market to inform profitable strategies, drive new efficiencies, and create competitive differentiation.

“The lock desk is a critical and expensive part of a mortgage operation and lenders are hungry to see how efficient and productive they are compared to others,” Happ said. “Optimal Blue is not only building software to support a more efficient, lights-out lock desk, but we now provide the visualizations to illustrate that efficiency in relation to their competition.”

Optimal Blue’s data engineering, data science, and product management teams worked hard to make the solution’s visualizations as compelling as possible so lenders can quickly understand and act on the analysis. The teams drew on the experience they gained in creating Optimal Blue’s Enterprise Analytics solution, which has received rave user reviews since being released two years ago.

Additionally, as part of an ongoing corporate effort to align product development closely to client needs, Optimal Blue’s product team conducted numerous collaborative feedback sessions with clients on Competitive Analytics through popular nationwide roadshows, conferences, and webinars. The results were impactful.

Ultimately, business intelligence that leads to improved efficiencies and a more competitive offering helps lenders better serve their most important stakeholder: the borrower. Daily insight into successful strategies to better serve borrowers and grow their businesses is the differentiating factor that lenders need in the current mortgage landscape.

“We are proud to announce the release of Competitive Analytics, which joins an established and growing base of data services offerings,” Happ concludes. “Optimal Blue is committed to helping our lenders visualize their business in new and unique ways, implement strategies to help them further differentiate, and aide them in their journey to better serve today’s mortgage borrower.”

This piece was originally featured on HousingWire.com.

###

PRESS CONTACT FOR OPTIMAL BLUE
Robert J. Brandt
Vice President, Marketing & Strategic Alliances
(469) 609-5585
bbrandt@optimalblue.com

— Unprecedented solution positions clients with sophisticated market comparison tools to gauge success —

Optimal Blue, the leading provider of secondary marketing solutions and data services in the mortgage industry, announced today the release of their Competitive Analytics solution. With mortgage rates at all-time lows, lenders are experiencing a surge in production, requiring access to real-time business intelligence to understand how well they are performing. Updated with new data daily, this game changing innovation positions Optimal Blue clients ahead of their peers by enabling them to gauge performance through sophisticated visualizations that illustrate market position, compare margins and profitability, and assess the effectiveness of current pricing strategies.

Competitive Analytics provides three types of sophisticated industry benchmarking capabilities, including:

• VOLUME BENCHMARKING
Advanced volume benchmarking allows the user to compare their loan production to the overall market and chart volume trends across specific time periods – by week, month, quarter, or year. In addition, volume benchmarking provides a production percentile market rank by business channel, institution type, state, MSA, loan type, and other parameters, as well as the ability to compare the percentage of their locks that observed change requests or lock extensions to the overall market.
• LENDING PROFILE BENCHMARKING
Lending profile benchmarking enables clients to compare characteristics of their loan production by charting loan level parameters such as FICO, LTV, loan amount, property type, occupancy, loan type, and loan purpose against the overall market.
• PRICING STRATEGIES BENCHMARKING
Pricing strategies benchmarking provides a market comparison for a variety of secondary marketing metrics that impact profitability. Through this powerful capability, clients can compare margins, concessions, price, and note rate to the market, and filter by business channel, institution type, state, MSA, and more.

Competitive Analytics joins Optimal Blue’s already established suite of business intelligence offerings including the Optimal Blue Mortgage Market Indices™ (OBMMI™) published earlier this year, as well as the unrivaled Enterprise Analytics solution which provides Optimal Blue clients with compelling visualizations that illustrate highly granular data on their own operation.

“The Optimal Blue Marketplace Platform has supported the daily activity of mortgage buyers and sellers for close to two decades,” explained Scott Happ, CEO of Optimal Blue. “This has generated an incredible amount of transactional data that uniquely positions Optimal Blue to achieve an entirely new scope of market transparency and competitive insight.”

###

PRESS CONTACT FOR OPTIMAL BLUE
Robert J. Brandt
Vice President, Marketing & Strategic Alliances
(469) 609-5585
bbrandt@optimalblue.com