
COMPETITIVE ANALYTICS
Compete better by knowing exactly where you stand in every market.
Remain at the forefront of the competition with sophisticated industry benchmarking tools that illustrate market performance and enable you to compare margins, profitability, and assess the effectiveness of strategies.
BENCHMARK BY PRICING METRICS
QUICKLY ASSESS YOUR PRICING
Rate & Price benchmarking allow you to quickly understanding how your PPE pricing differs from the market so you can quickly assess how conservative or aggressive your pricing is relative to competitors. View these comparisons at the business channel or branch level measured against the market allowing you to hone in on specific strategies based on your site configuration.
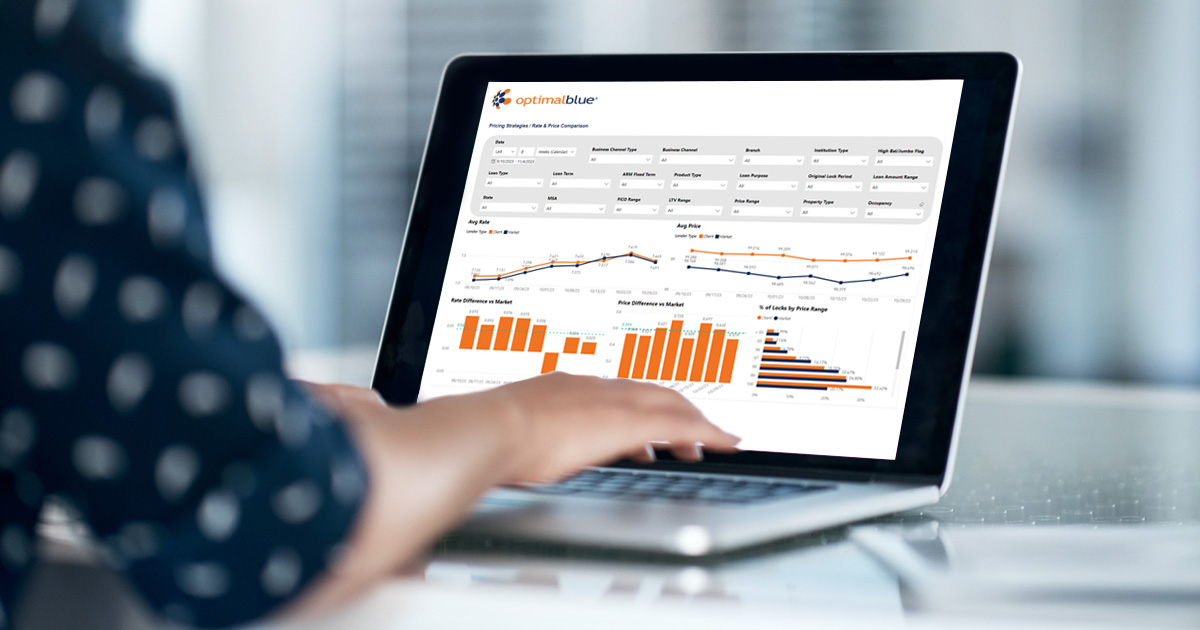
BENCHMARK BY PRICING STRATEGY
BETTER POSITION YOUR COMPANY FOR SUCCESS
We provide a market comparison for a variety of secondary marketing metrics that impact profitability. View margins and concessions side by side for any region, and compare your organization to the average margin and issued concessions of your competitors. Filter by business channel, institution type, state, MSA, product, and much more.

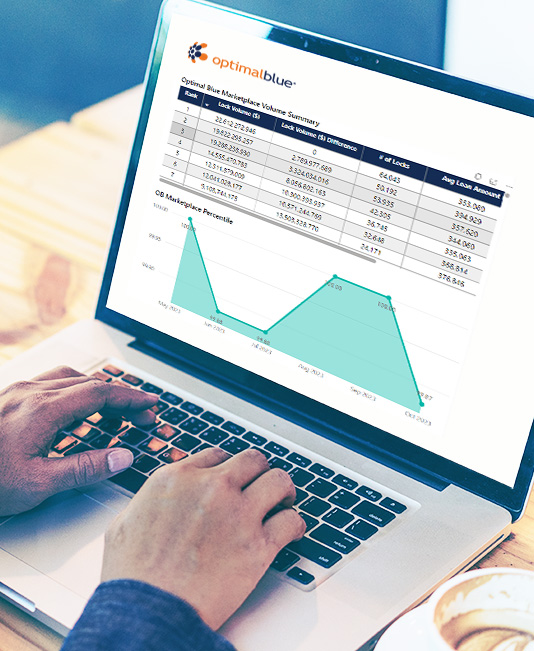
BENCHMARK BY VOLUME
VIEW LOAN PRODUCTION TRENDS
Advanced volume benchmarking allows you to compare loan production to the overall market and chart trends across specific time periods like week, month, or year.
Users also benefit from the ability to compare the percentage of locks that observed change requests or lock extensions to the overall market, as well as historically tracking market share by production percentile market rank comparisons. Filtering parameters include:
Business channel
Institution type
State or MSA
Loan type
And many more!
BENCHMARK BY PROFILE
COMPARE & CHART AT THE LOAN LEVEL
Lending profile benchmarking allows you to easily compare characteristics of your loan production by charting loan level parameters such as FICO, LTV, loan amount, property type, occupancy, loan type, and loan purpose against the overall market.

CONFIDENTLY & ACCURATELY GAUGE PERFORMANCE
Optimal Blue has supported the daily activity of mortgage buyers and sellers for close to two decades, generating an incredible amount of transactional data and uniquely positioning them to achieve an entirely new scope of market transparency and competitive insight.

WHAT'S THE BENEFIT OF COMPETITIVE ANALYTICS?
I'm Erin Wester, Chief Product Officer at Optimal Blue. Competitive Analytics is a game changer! Updated with new transactional data daily, it is a sharp contrast to historical HMDA or survey data that lenders have relied upon in the past. Our clients are ecstatic with their sudden ability to have full visibility into what’s happening elsewhere in the market and with their peers. They crave this type of granular data because it puts the power in their hands! Are you ready to hear what all of the buzz is about?
USE CASES
HOW CLIENTS USE OUR COMPETITIVE MORTGAGE MARKET DATA
Gain confidence in geographical pricing strategies by analyzing rate and price comparisons with the market, while simultaneously drilling deep into margin and concession benchmark capabilities.
INSIGHTS
BE MORE COMPETITIVE WITH ACTIONABLE DATA & ANALYTICS
Lenders are experiencing a surge in production, requiring access to real-time business intelligence to understand how well they perform. Discover innovative tools to gauge performance through dynamic visualizations that illustrate market position, compare margins and profitability, and assess the effectiveness of strategies.
COMPETITIVE DATA LICENSE
Competitive Data License empowers lenders to confidently set competitive rates, maximize profitability, and respond swiftly to market changes.
COMPETITIVE DATA LICENSE
A DATA SOLUTION TO OPTIMIZE YOUR ADVANTAGE
Optimize margins and remain competitive in any market by analyzing data at a granular level. Unparalleled granularity in Competitive Data License informs pricing decisions that align with set business goals.
DIFFERENTIATE YOURSELF IN A COMPETITIVE MARKET
Using data representative of over 35% of U.S. mortgage locks, Competitive Data License empowers lenders to confidently set competitive rates, maximize profitability, and respond swiftly to market changes. Gain actionable insights to identify areas for improvement, replicate successful strategies, and stay ahead in any market.
Optimize your advantage with more granular pricing insights, the ability to benchmark against the market, post-lock information, and competitive analytics.
RELATED SOLUTIONS
ENABLE BETTER DECISIONS
Leverage the full suite of Optimal Blue's actionable data and analytics services to visualize and track performance, compare profit margins, and assess the effectiveness of your secondary marketing strategies.