September 8, 2026
Optimal Blue report: Mortgage demand slips below year-ago levels as rate-and-term refi activity plunges
Execution spreads tighten as hedge mix shifts and MSR values rise
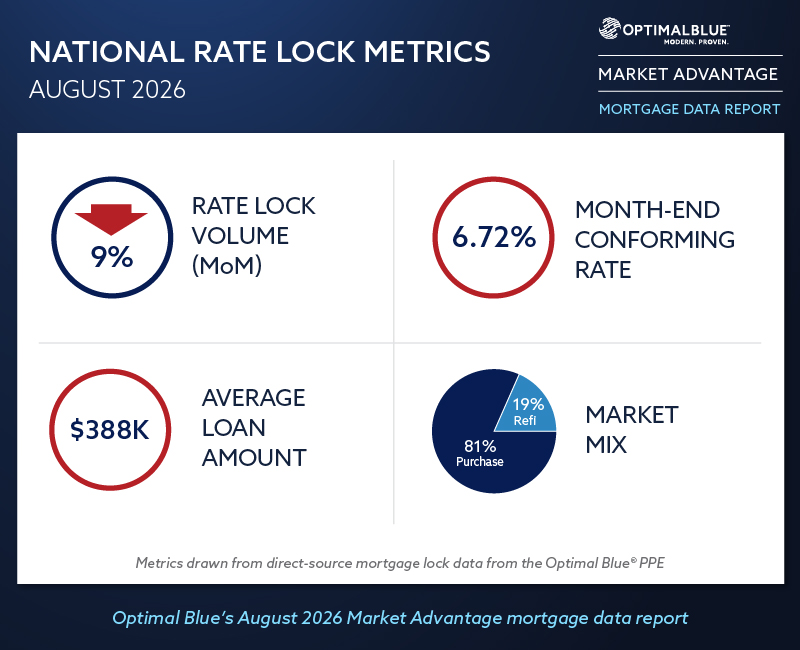
PLANO, Texas, Sept. 8, 2026 – Optimal Blue today released its August 2026 Market Advantage mortgage data report, which found that mortgage activity continued to soften in August even as rates leveled off. Total rate-lock volume declined 9% month over month (MoM) and slipped 3% below August 2025 levels. Purchase lock volume fell 10% from July but remained 6% higher year over year (YoY), with purchase loans accounting for nearly 81% of total lock volume. Refinance share ended the month at more than 19% of total production, while rate-and-term refinance volume dropped 47% YoY and declined 13% MoM.
Mortgage rates saw little change across major products in August. The Optimal Blue Mortgage Market Indices (OBMMI) 30-year conforming fixed rate, the benchmark for CME Group's Mortgage Rate futures, ended the month at 6.72%, unchanged from July but 28 basis points (bps) higher than three months ago and up 23 bps YoY. The 10-year Treasury yield held flat at 4.75%, while the spread between the 10-year Treasury and the OBMMI 30-year conforming rate was unchanged at 197 bps. The spread was nearly 30 bps tighter than a year ago, partially offsetting the impact of higher Treasury yields.
"After a sharp move higher in July, rates leveled off in August, but that pause didn't translate into stronger volume," said Brennan O’Connell, director of data solutions at Optimal Blue. "Purchase activity is still running ahead of last year, but with rate-and-term refinance volume down 47%, there just isn’t much refinance demand to support the broader market. With rates still elevated and our 12-month forecast pointing to only gradual relief, the market remains highly sensitive to even modest changes in borrowing costs."
On the secondary side, execution spreads tightened across most major products, with the best-efforts-to-mandatory spread for conventional 30-year loans narrowing 4 bps to 26 bps and the 15-year spread narrowing 3 bps to 37 bps, while the government 30-year spread held flat at 16 bps. Mortgage servicing rights (MSRs) for conforming 30-year loans increased 4 bps to 1.38%, a 5.52 multiple, moving in line with a monthly OBMMI average that rose 11 bps. The share of loans sold at the highest price tier declined from 79% to 77%, while the share of loans sold with servicing retained increased 4 percentage points to 57%, rebounding from 53% in June and July. The report also shows lenders continuing to concentrate their hedges in the UM30 5.5, the 5.5% coupon for 30-year uniform mortgage-backed securities (MBS). It accounted for 62% of hedges in August, compared with 27% of production slotting into the 5.5 coupon and 25% into the 6.0 coupon.
“We saw a mixed secondary-market picture in August, with tighter execution spreads and higher MSR values alongside some deterioration in top-tier execution share,” said Mike Vough, Optimal Blue’s senior vice president of corporate strategy. “Servicing retention also moved back up to 57%, while the UM30 5.5 remained the dominant hedge even as production was more distributed across the 5.5 and 6.0 coupons. That gap between hedge concentration and where production is actually slotting is worth watching closely.”
Key findings from the Market Advantage report include:
Volume trends and market composition
Refi pullback deepens: Rate-and-term refinance volume declined 13% MoM and 47% YoY. Cash-out refinance volume fell 3% MoM and 5% YoY. Refinance share nevertheless increased 40 bps to more than 19% of total production.
Purchase demand slows: Purchase lock volume fell 10% MoM but remained 6% higher YoY. Purchase loans accounted for nearly 81% of total lock volume in August.
Conforming loses ground: Conforming share declined to 47% of total production, down 38 bps MoM and more than 4 percentage points YoY. Non-conforming share held at nearly 21%, while FHA increased 74 bps to nearly 20% and VA declined 44 bps to nearly 12%.
Non-QM tops 11%: Non-qualified mortgage (non-QM) loans accounted for more than 11% of total lock volume in August, up 1 percentage point MoM and 3 percentage points YoY. Investor and debt service coverage ratio (DSCR) loans represented more than 35% of non-QM production, up 1.7 percentage points MoM, while bank statement loans accounted for nearly 30%.
ARM share eases: Adjustable-rate mortgages accounted for 10.5% of lock volume in August, down 55 bps MoM but remaining slightly above year-ago levels.
Property mix stays stable: Single-family detached homes accounted for more than 63% of production in August. Planned unit developments (PUDs), a proxy for new-construction activity, represented more than 28% of volume, down 51 bps MoM but still 49 bps higher YoY. Condominiums accounted for 6% of production and manufactured housing nearly 2%.
Rates and pricing
Rates level off: The OBMMI 30-year conforming fixed rate ended August at 6.72%, unchanged MoM and 23 bps higher YoY. The 10-year Treasury yield held at 4.75%, while the spread between the 10-year Treasury and the OBMMI 30-year conforming rate remained at 197 bps, nearly 30 bps tighter than a year ago. The average rate locked through Optimal Blue's product, pricing, and eligibility (PPE) engine was 6.48%.
MSR values rise: MSRs for conforming 30-year loans increased 4 bps to 1.38%, a 5.52 multiple.
Top-tier executions slip: The share of loans sold at the highest price tier declined 172 bps to 77%. Second-ranked executions increased 141 bps to 13%, while third-ranked executions were essentially unchanged at 3% and fourth-tier or lower executions increased 39 bps to 7%.
Market outlook
Rates forecast to rise, then ease: The OBMMI 30-year conforming fixed rate is forecast at 6.74% over the next month and 6.82% over three months before easing to 6.51% over the next 12 months.
Spread forecast to stay near 1%: The primary-secondary spread is forecast to narrow from 1.09% currently to 1.04% over the next month and 1.03% over three months before returning to 1.04% over the next 12 months.
Channel and execution
Hedged sales shift toward MBS: The share of hedged loan sales delivered via MBS increased 300 bps MoM to 43%. Bulk executions declined 1 percentage point MoM to 24%, cash executions held at 32%, and best-efforts executions declined 1 percentage point MoM to 2%.
Execution spreads compress: Best-efforts-to-mandatory spreads for conventional 30-year products narrowed 4 bps MoM to 26 bps. Conventional 15-year spreads narrowed 3 bps MoM to 37 bps, while government 30-year spreads held flat MoM at 16 bps.
Spec-eligible share holds at 80%: The share of a lender's pipeline eligible for specified pool delivery remained at 80% in August. The share of loans originated in New York, Florida, Texas or Puerto Rico increased 31 bps MoM, while the $350,000 unpaid principal balance (UPB) tier declined 29 bps.
UM30 5.5 hedge share eases: The UM30 5.5 accounted for 62% of hedges in August, down from 67% in July. That compares with 27% of production slotting into the 5.5 coupon and 25% into the 6.0 coupon.
Servicing retention rebounds: The share of loans sold with servicing retained increased 4 percentage points MoM to 57%, up from 53% in June and July.
Product mix and borrower profiles
First-time buyer shares hold steady: First-time homebuyer share was unchanged MoM across conforming (44%), FHA (70%) and VA (45%) loans. Compared with a year ago, conforming share increased 2 percentage points and FHA 1 percentage point, while VA declined 1 percentage point.
DTIs stay flat: Purchase debt-to-income (DTI) ratios were unchanged in August, with conforming borrowers at 36.7%, FHA borrowers at 43.5% and VA borrowers at 43.1%. Compared with a year ago, DTIs were down 0.2 percentage points for conforming borrowers, 1.1 points for FHA borrowers and 0.7 points for VA borrowers.
Credit quality stays solid: The average credit score across all locks nationwide was 729 in August, ranging across the top 20 metros by volume from 719 in Atlanta to 757 in the San Francisco Bay Area. Purchase credit scores averaged 734, down 1 point MoM and 3 points YoY. Rate-and-term refinance scores averaged 738, up 2 points MoM and 1 point YoY, while cash-out refinance scores averaged 697, up 1 point MoM and 2 points YoY. Conforming borrowers averaged 752, down 1 point MoM and 4 points YoY. FHA borrowers averaged 677, essentially unchanged MoM and up 2 points YoY, while VA borrowers averaged 714, down 2 points MoM but up 3 points YoY.
Pull-through improves: Purchase pull-through increased 6 percentage points MoM to 84.9%, while refinance pull-through rose nearly 3 percentage points MoM to 72.8%. YoY, purchase pull-through was 68 bps higher and refinance pull-through was nearly 12 percentage points higher.
Loan size declines: The average locked loan amount declined to $388,000 in August from $395,000 in July, a decrease of nearly 2%. Average loan-to-value (LTV) ratios nationwide were 80.9%, ranging across the top 20 metros by volume from 70.4% in the greater Los Angeles area to 84.6% in Houston.
To view the full August 2026 Market Advantage report, complete the free subscription form: https://engage.optimalblue.com/market-advantage.
Subscribers receive a report PDF each month with the latest data. Members of the press are eligible for special, advance access each month and should contact Alexandra Kreuter to be added to the media list.
About the Market Advantage Data Report
Optimal Blue issues the Market Advantage mortgage data report each month to provide insight into U.S. mortgage trends and drivers of lending profitability. Data is sourced from the Optimal Blue PPE, which is used to price and lock more than one-third of all mortgages nationwide, and Optimal Blue’s hedging and loan trading system, which supports approximately 40% of loans hedged and sold into the secondary market. The report also includes forward-looking rate and spread forecasts generated by Virtual Economist, an AI- and machine learning-powered forecasting tool built on public economic data and Optimal Blue's proprietary lock volume data. As the leader in mortgage capital markets technology, Optimal Blue has a direct view of both origination and secondary market activity and the interconnectedness of the two. Unlike self-reported survey data, Optimal Blue’s direct-source data accurately reflect the in-process loans in lenders’ pipelines and secondary market executions. Visit Optimal Blue’s website to subscribe to receive the free report each month.
Nothing herein shall be construed as, nor is Optimal Blue providing, any legal, trading, hedging or financial advice.
About Optimal Blue
Optimal Blue powers strategic performance across the mortgage capital markets ecosystem. As the industry’s only end-to-end capital markets platform, our technology, data and integrations bridge the primary and secondary markets to help lenders of all sizes optimize performance – from pricing accuracy to margin protection and every step in between. Backed by over 20 years of proven expertise, our modern, cloud-native technology delivers the real-time automation, actionable data and seamless connectivity lenders need to navigate market volatility and scale for growth. To learn more about how Optimal Blue helps deliver measurable ROI, visit OptimalBlue.com .
Media Contacts:
Alexandra Kreuter, Optimal Blue
732.861.5012
Alexandra.Kreuter@OptimalBlue.com
Leslie Colley, Depth for Optimal Blue
678.622.6229
Leslie@DepthPR.com